

Dipole Antenna FM Radio Frequency Analysis
I. Objective
In this experiment describe about RF Environment Analysis course since 10 November 2017. For that time, we have studied about how to analyze the FM radio frequency around Phnom Penh by using the Dipole antenna which design for receive FM signal and also using Spectrum Analyzer to connect with our Dipole antenna to process in this experiment.II. Equipment
To process the experiment for this lab we need equipment such as:- Compass: using for location of FM radio station.
- Dipole Antenna (Frequency 101MHz): use it to analyze signal from FM radio station.
 |
| Figure 1: Dipole antenna. |
- Spectrum Analyzer (RIGOL, DSA705, S/No: DSA8B182500542): use it to analyze FM signal from FM radio through the antenna.
 |
| Figure 2: Spectrum Analyzer (RIGOL DSA705). |
III. Methodology
Firstly, we need to design the Dipole antenna for receive FM signal. After that, we have connected the designed antenna to Spectrum Analyzer to process our experiment.During the experiment, we need to use reference frequencies of FM radio station to analyze on Spectrum Analyzer, next we rotated the antenna to find strength signal of Gain and find its direction by compass.
Finally, if the antenna can find the strength signal direction, then we have noted these information as the result and do it with the different reference frequencies of FM radio around Phnom Penh.
IV. Result and Discussion
After we finished those experiment we have got some information about it and collected it in the table below.

According to the table above, for 2nd column is the frequency of FM radio in Cambodia, 3rd column is the gain value of experiment in Spectrum Analyzer with Dipole antenna receiver, and the 4th column is the direction of radio station which we got higher signal. By the 3rd column of Gian there are 8 results from experiment, those values mean that if the gain value is bigger, so the strength signal that we got is higher. The gain value is smaller, the strength signal will be lower.
 |
| Figure 3: Frequency of FM radio 88MHz and its Gain by Spectrum Analyzer. |
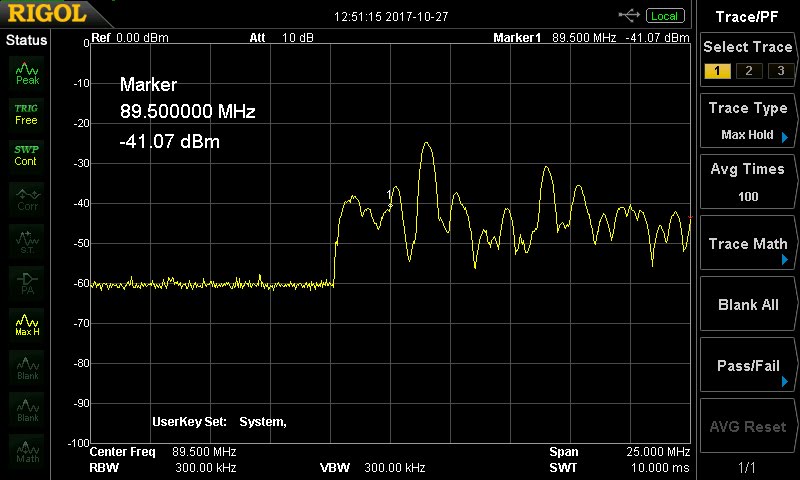 |
| Figure 4: Frequency of FM radio 89.5MHz and its Gain by Spectrum Analyzer. |
For figure 3 and figure 4 are the output frequencies on Spectrum Analysis, we see that the output gain (dBm) value of figure 3 is bigger than figure 4, so the signal of figure 3 also get higher than.
V. Conclusion
After we have an experiment, we can conclude that the direction of high signal by rotation is also the direction of its FM radio station.
If the Gain value is bigger than other value, so the signal of it is also stronger than other in this above graph and it also high signal if radio station nearby our experiment.
Royal University of Phnom Penh
Faculty of Engineering
Dep. Telecommunication and Electronic Engineering
Faculty of Engineering
Dep. Telecommunication and Electronic Engineering
Group Member:
1. Tann Thona
2. Ly Seyha
3. Sim Pichdany
4. Nop Da
5. El Chuer
Instructor: Dr. Bae Dae Hwan
Experiment Date: 10 November 2017
Instructor: Dr. Bae Dae Hwan
Experiment Date: 10 November 2017


0 Comments