

Mobile Phone Broadcasting (1G, 2G, 3G, and 4G) Field Strength Analysis in Royal University of Phnom Penh Zone
Ly Seyha, Cheasim Samnang, Pov Vannak, Ven Seyha, Tann Thona, Phan Theara, Chim Socheat, Nop Da, Keng Chhit, Long Ty, Ham Sovann, Chhory Noreath
Dept. of Telecommunication and Electronic Engineering, Royal University of Phnom Penh, Russia Federation Blvd (110), Cambodia
{seyhaly.fe, samnangc96, vanakpov2, venseyha88, tannthona, theara.phan010, chimsocheat978, nopda.fe, kengchhit, longty096, hamsovann96, noreath.chhoy123}@gmail.com
All authors contributed equally to this work
All authors contributed equally to this work
Abstract
In this article is discussed about mobile phone field testing in Royal University of Phnom Penh (RUPP) zone by using Waveguide Horn antenna of maximum operated frequency 18GHz to received signal from the free-space. We used the high operate frequency spectrum analyzer (up to 9KHz – 22GHz) for scanning and analyses the signal from the Horn antenna of mobile phone of 1G (800-900MHz), 2G (900MHz-1.2GHz), 3G (1.2-1.8GHz), and 4G (1.8-2.1GHz). To analyses signal, we spent a day (9 hours) to test with 5 main locations in RUPP. After finish the experiment, we have got some information result and data statistic to analyses the comparison of power gain in the testing location and then make a conclusion for those data.
Keywords— Gain, Horn Antenna, Spectrum Analyzer, Power Testing, RF Environment Testing, Antenna Testing, Mobile Phone (1G, 2G, 3G, 4G) Testing Field.
I. INTRODUCTION
Nowadays, companies are using their own policies to broadcast frequency with the only power of 10KW to cover around Phnom Penh, but some companies did fail by broadcasting frequency with more than 10KW, Electromagnetic field is very effective to people health if the broadcasting of the strong power. Anyway, we have analyzed field effect in Royal University of Phnom Penh (RUPP) zone to understanding over power effective to people with RF Environment Analysis by using Horn Antenna and Spectrum Analyzer. At that time, we have spent a day (9 hours) to tested with 5 locations around Royal University of Phnom Penh (RUPP) with the different antenna height.
The information of locations of our experiment was held on the description below:
The information of locations of our experiment was held on the description below:
Nowadays, companies are using their own policies to broadcast frequency with the only power of 10KW to cover around Phnom Penh, but some companies did fail by broadcasting frequency with more than 10KW, Electromagnetic field is very effective to people health if the broadcasting of the strong power. Anyway, we have analyzed field effect in Royal University of Phnom Penh (RUPP) zone to understanding over power effective to people with RF Environment Analysis by using Horn Antenna and Spectrum Analyzer. At that time, we have spent a day (9 hours) to tested with 5 locations around Royal University of Phnom Penh (RUPP) with the different antenna height.
The information of locations of our experiment was held on the description below:
A. Location 1
- Address of Location: 11°34'12.9"N 104°53'27.1"E
B. Location 2
The 2nd location of our experiment was on the 4th floor of building B in RUPP which represent the antenna height of 15m.
- Address of Location: 11°34'12.1"N 104°53'22.7"E
C. Location 3
The 3rd location of our experiment was on the 6th floor of building A in RUPP which represent the antenna height of 25m.- Address of Location: 11°34'07.1"N 104°53'27.4"E
D. Location 4
The 4th location of our experiment was in front of CJCC building in RUPP zone which represent the antenna height of 1.2m.
- Address of Location: 11°34'07.4"N 104°53'36.9"E
E. Location 5
The 5th location of our experiment was on the roof of CKCC building in RUPP which represent the antenna height of 13m.
- Address of Location: 11°34'08.3"N 104°53'18.1"E
II. EQUIPMENT AND METHODS
To process this experiment of mobile phone testing field with generation type (1G, 2G, 3G, and 4G) we need some equipment such as:
- Waveguide Horn Antenna (Model: hp 3115, Serial/No. 9901A5662): are very popular use at UHF (1 - 18GHz) and higher frequencies. Horn antennas often have a directional radiation pattern with a high antenna gain, which can range up to 25 dB in some cases, with 10 - 20 dB being typical. Horn antenna have very little loss, so the directivity of a horn is roughly equal to its gain. The radiation pattern of a horn antenna will depend on B and A (the dimensions of the horn at the opening) and R (the length of the horn, which also affects the flare angles of the horn), along with band a (the dimensions of the waveguide). These parameters are optimized in order to tailor the performance of the horn antenna, and are illustrated in the following Fig. 1.
- Spectrum Analyzer (Model: hp 8562A, Serial/No. 3017A05067): use it to measures the magnitude of an input signal versus frequency within the full frequency range of the instrument. The input signal that a spectrum analyzer measures is electrical. It operates well with input connector of 50ohm and frequency from 9KHz to 22GHz (see Fig. 2 for front panel), and the LINE input operates at normally 115V (47 – 440Hz) or at normally 230V (47 – 66Hz). See the back panel in the Fig. 3.
- Compass: is also use in this experiment, it uses for finding the direction of the high-power performance from broadcasting power source.
- GPS: use it to find the location of performance experiment.
 |
| Fig. 1 Geometry of the double ridged horn antenna. |
 |
| Fig. 2 Spectrum analyzer model hp 8562A as front view. |
 |
| Fig. 3 Spectrum analyzer model hp 8562A as back view. |
III. EXPERIMENT
To process this fully experiment propose we did the test on the high position and testing it step by step. Firstly, we need to find a high position with no obstacle around, then let checking the environment around that location is it effective more or less, so try to find the better one of effective. After that we can start the experiment by:
- Firstly, checking the AC input power that provide to Spectrum Analyzer, if AC power source fit to the Spectrum Analyzer input LINE containing, so the operate will starting.
- Setting start and stop frequency of range from 700MHz to 2.9GHz to analyze the magnitude spectrum and frequency of mobile phone (1G, 2G, 3G, and 4G) by pushing on FREQUENCY button panel.
- Start checking and cleaning the connector N-male type to protect the problem of Spectrum Analyzer because it works with the high frequency, then connect the Horn Antenna to Spectrum Analyzer via RF coaxial cable and N-male connector type of 50ohm impedance.
- Press on TRACE button panel to do the MAX HOLD to signal, and then pushing VIEW to freeze the signal.
- Let press on MARKER panel to check each magnitude spectrum power and frequencies that showing on Spectrum Analyzer’s monitor.
Checking it one by one until you finish your experiment propose of mobile phone testing with 1G, 2G, 3G, and 4G.
Environment is the main part of effective to analyze the data signal, it is also focus with the weather, so after you finish your signal testing, you need to checking about environment and weather in the detail.
Environment is the main part of effective to analyze the data signal, it is also focus with the weather, so after you finish your signal testing, you need to checking about environment and weather in the detail.
IV. RESULTS AND DISCUSSIONS
After we finished those experiment we have got some information about it and collected it in the table below.
- TABLE I
 |
| RESULT OF EXPERIMENT OF LOCATION1 ON ROOF OF BUILDING C. |
 |
| Fig. 4 Data of Location1. |
- TABLE II
 |
| RESULT OF EXPERIMENT OF LOCATION2 OF 4TH FLOOR, BUILDING B. |
 |
| Fig. 5 Data of Location2. |
- TABLE III
 |
| RESULT OF EXPERIMENT OF LOCATION3 OF 6TH FLOOR, BUILDING A. |
 |
| Fig. 6 Data of Location3. |
- TABLE IV
 |
| RESULT OF EXPERIMENT OF LOCATION4 IN FRONT OF CJCC BUILDING. |
 |
| Fig. 7 Data of Location4. |
- TABLE V
 |
| RESULT OF EXPERIMENT OF LOCATION5 ON ROOF OF CKCC BUILDING. |
 |
| Fig. 8 Data of Location5 |
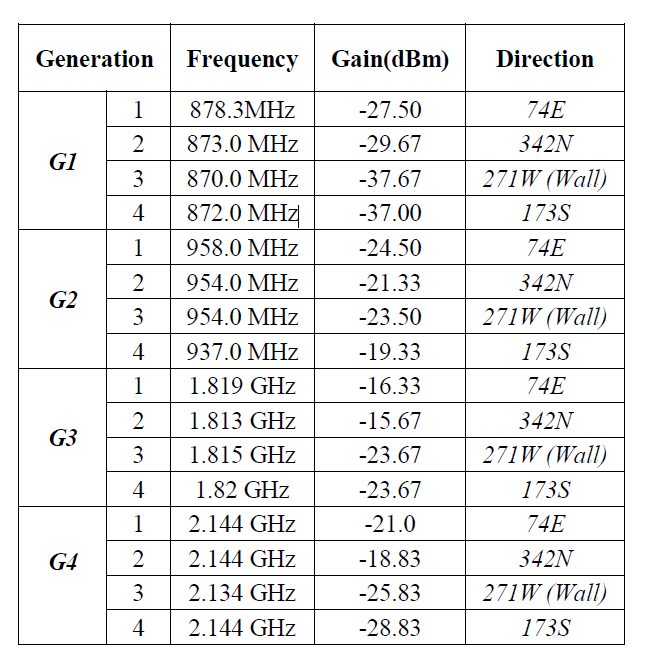
According to TABLE I and Fig. 4, we can observe that:
- For 1G, the direction East has the highest power gain among the three others (-27.5dBm) because there is no effective by any environment and maybe power source of 1G comes from this direction and the direction West has the lowest gain (-37.67dBm) because it has reflected by wall of building C.
- For 2G, the direction South has the highest gain (-19.33dBm) among the three others because maybe the power source of 2G comes from this direction and the direction East has the lowest gain (-24.5dBw) because maybe the power source does not come from this direction.
- For 3G, the direction North has the highest gain (-15.67dBm) among the three others because there is no effective by any environment and maybe power source of 3G comes from this direction and direction West has the lowest gain (-23.67dBw) because it is being reflected my wall of building C.
- For 4G, the direction N has the highest gain (-18.83dBm) among the three others because there is no effective by any environment and maybe power source of 4G comes from this direction and the direction South has the lowest gain (-28.83dBw).
Base on TABLE II and Fig. 5, we can observe that:
- For 1G, the direction North has the highest gain (-23.00dBm) among the three others because there is no effective by any environment and maybe power source of 1G comes from this direction and direction East has the lowest gain (-29.00dBw).
- For 2G, the direction West has the highest power gain (-26.00dBm) among the three others and direction East has the lowest gain (-30.00dBw).
- For 3G, the direction West has the highest power gain (-20.83dBm) among the three others and direction North has the lowest gain (-32.33dBw).
- For 4G, the direction East has the highest power gain (-22.83dBm) among the three others and direction North has the lowest gain (-33.33dBw).
Base on TABLE III and Fig. 6, we can observe that:
- For 1G, the direction North has the highest gain (-15.67dBm) among the three others and direction West has the lowest gain (-23.67dBw).
- For 2G, the direction West has the highest gain (-24.83dBm) among the three others and direction South has the lowest gain (-32.83dBw).
- For 3G, the direction West has the highest gain (-21.33dBm) among the three others and direction South has the lowest gain (-35dBw).
- For 4G, the direction East has the highest gain (-20.83dBm) among the three others and direction South has the lowest gain (-42.17dBw).
According to TABLE IV and Fig. 7, we can observe that:
- For 1G, the direction North has the highest gain (-29.33dBm) among the three others and direction East has the lowest gain (-30.5dBw).
- For 2G, the direction North has the highest gain (-27.83dBm) among the three others and direction South has the lowest gain (-40.5dBw).
- For 3G, the direction South has the highest gain (-20.83dBm) among the three others and direction West has the lowest gain (-31.17dBw).
- For 4G, the direction South has the highest gain (-26.67dBm) among the three others and direction East has the lowest gain (-33.33dBw).
According to TABLE IV and Fig. 8, we can observe that:
- For 1G, the direction North has the highest gain (-17.67dBm) among the three others and direction East has the lowest gain (-30dBw).
- For 2G, the direction West has the highest gain (-24.33dBm) among the three others and direction South has the lowest gain (-34.17dBw).
- For 3G, the direction East has the highest gain (-20.33dBm) among the three others and direction West has the lowest gain (-31.83dBw).
- For 4G, the direction East has the highest gain (-26.33dBm) among the three others and direction South has the lowest gain (-32dBw).
In sum, the power Gain of those 5 locations can conclude that:
- At the building C with 14m of height antenna is the best location has good power Gain because of the location of experiment is on the roof and maybe cause of no effective by environment (tree, high building...) and there is many station or repeater around this location.
- At the location4 of in front of CJCC with the antenna height 1.2m where the location of ground which has a lot of obstacle of building and some trees effective around it and has the lowest gain if compared to others location of experiment.
- For direction have reflection is OK that has the medium gain no problem.
For the generation type of mobile phone in Cambodia, we can conclude that:
- For 1G, assume that it is the 1st generation that popularity in using of voice calling, so the broadcasting power also around.
- For 2G, it is the 2nd generation technology that if compare to 1G, it uses to extent the number of users in a radio channel as digital, assume that it uses for voice and data signal as 1G, but it is not popular to use, so the signal is less.
- For 3G, it is next generation of 2G, it uses for voice, data, and especially uses for video telephony and internet surfing. It is a high-speed network that also popularity in using, so that it is wide-band of broadcasting the gain power around the experiment.
- For 4G is a recently generation which did not cover openly in Cambodia and it also include with the block of number of user, so the broadcasting power is less.
V. CONCLUSION
Totally, the experiment propose is to analyzes RF signal of mobile phone with 1G, 2G, 3G, and 4G, which broadcasting power from mobile phone station or its repeater by using a high frequency Spectrum Analyzer and Waveguide Horn Antenna.
After we got the data information from this experiment, according to these data will use to analyze which location has obstacle effective, reflected by the building, or any effective else, so that the result of Gain power that we got does depend on that effective environment.
A. In Case of High Gain Power
Usually, all locations of no effective environment or reflective object are the better location to do the field test where the received power is higher of others because the reflector can also cause that the signal will reactant to receiver antenna.
B. In Case of Low Gain Power
We can assume that even though the testing location has no environment effective, it is possible that there is no power source of antenna transmitter in line with our experiment antenna.
REFERENCES
[1] Bevilaqua, Peter (2009). "Horn antenna - Intro". Antenna-theory.com website. Retrieved 2010-11-11.
[2] Bakshi, K.A.; A.V. Bakshi, U.A. Bakshi (2009). Antennas And Wave Propagation. Technical Publications. pp. 6.1–6.3. ISBN 81-8431-278-4.
[3] Available: https://support.chinavasion.com/index.php?/Knowledgebase/Article/View/284/42/1g-2g-3g-4g---the-evolution-of-wireless-generations.


0 Comments