

Thailand’s TVs Broadcasting Power Strength Across Cambodia-Thailand Border into Koh Kong Province of Cambodia
Seyha Ly, Samnang Cheasim, Vannak Pov, Seyha Ven, Thona Tann, Theara Phan, Socheat Chim, Da Nop, Chhit Keng, Ty Long, Sovann Ham, Noreath Chhory, Tharoeun Thap*, and Dae-Hwan Bae*
Dept. of Telecommunication and Electronic Engineering, Faculty of Engineering, Royal University of Phnom Penh, 110 Boulevard, Phnom Penh, Cambodia
{seyhaly.fe, samnangc96, vanakpov2, venseyha88, tannthona, theara.phan010, chimsocheat978, nopda.fe, kengchhit, longty096, hamsovann96, noreath.chhoy123}@gmail.com
*Correspondence: whymper@gmail.com (DHB); wec.tharoeun@gmail.com (TT)
All authors contributed equally to this work.
Abstract
In Thailand has several hundred TV and radio stations which broadcast frequency on TV channel and both AM and FM wave bands, they also get the permission from International Telecommunication Union (ITU) to broadcast specific frequencies of them same as Cambodia and other country, but we did not know how they broadcasting their frequencies. In case of over power broadcasting from Thailand across into Cambodia, so we decided to choose Koh Kong city to test frequencies and power strength from Thailand by spending 18 hours of 3 days. In this article, we discussed about TV channel field testing at Cambodia-Thailand boundary zone by using Bilog antenna and spectrum analyzer. To analyze the signal, we spent a day (18 hours) to test with 2 main broadcasting frequencies from Thailand and its location of testing is in Koh Kong City Hotel with a high position. After finish the experiment, we have got many information result and data statistic to analyze the comparison of power gain in the testing location and then make a conclusion for those data. We made up this project in order to find solution for stopping and preventing in the future since it illegal and may affect to our living especially people who living there such as; traditional, language, culture, civilization, and nationality.
Keywords— Gain, Bilog Antenna specification, Power limitation, Power Testing, RF Environment testing, Antenna testing, TV frequency Testing.
I. INTRODUCTION
Thailand country also get the permission from International Telecommunication Union (ITU) to broadcast specific frequencies of TV channels and radio both AM and FM the same as Cambodia and other countries in the world, but we did not know they follow the frequency’s law of ITU, so we decided to spent 18 hours of 3 days to test the field frequencies at Koh Kong province. In the field test, we want to check frequencies and power signal over from Thailand to Cambodia at Koh Kong province. At there, we choose only frequencies from Thailand and there are two frequencies that we operated in this field test near border of Thailand.
We made up this experiment to find out the power that broadcast to Cambodia from Thailand in order to find solution for stopping and preventing in the future since it illegal and may affect to our living especially people who living there such as; traditional, language, culture, civilization, and nationality.
We made up this experiment to find out the power that broadcast to Cambodia from Thailand in order to find solution for stopping and preventing in the future since it illegal and may affect to our living especially people who living there such as; traditional, language, culture, civilization, and nationality.
A. Antenna Analysis
To performance experiment, we used Bilog Antenna with model of SCHAFFNER CBL6111C with frequency range 30MHz – 1GHz.
The CBL6111C is a high performance ultra-wideband Bilog Antenna for emission and immunity EMC testing. This is the original classic Bilog combining two antennas in one, making savings of at least 20 – 30% on test time and reducing measurement errors due to cable and connector wear.
The CBL6111C has been accepted worldwide for emission measurements. Although, used primarily as an emission measuring antenna, can handle power up to 300 watts, making it suitable for most immunity measurements requiring fields up to 10V/m, or even greater. The CBL6111C is linearly polarized and exhibits excellent balance (<1dB) and cross polarization performance (>20dB). As the description, Table 1, and Fig. 1 of the CBL6111C Bilog antenna has been descripted in [1].
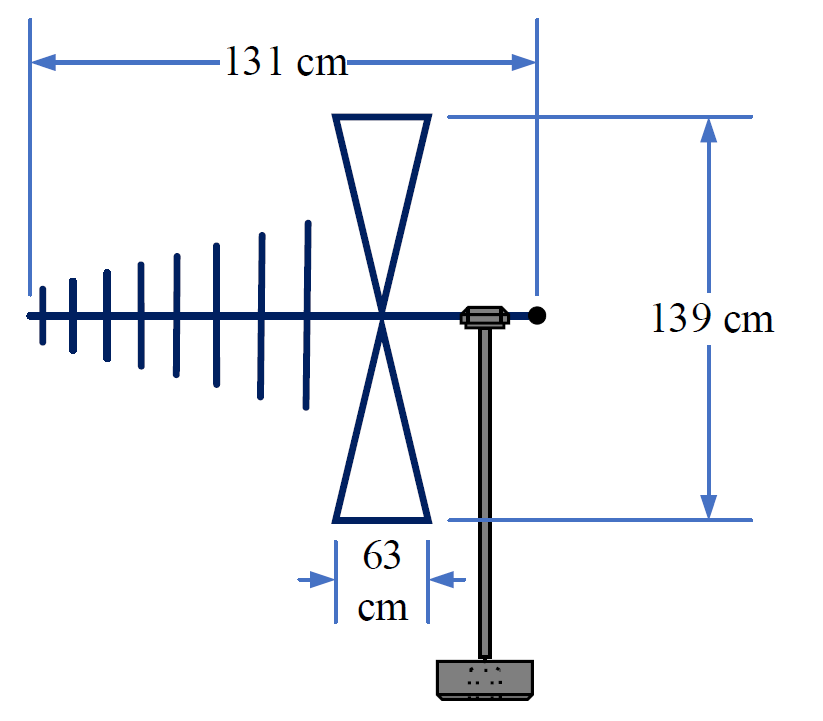 |
| Fig. 1 Dimension of Bilog antenna. |
 |
| TABLE I: TECHNICAL SPECIFICATIONS OF BILOG ANTENNA. |
1) RG-58 Cable loss: RG-58 is a type of coaxial cable often used for low-power signal and RF connections. The cable has a characteristic impedance of either 50 or 52 Ω. As the description, has been expressed in [2].
Values are nominal 25°C performance calculations. Actual measured values may vary from the calculated values based on manufacturing tolerances, cable assembly length, connector performance, actual operating frequency, and measurement accuracy. The power handling calculation is based on operation under controlled conditions: 25°C, sea level, still air (natural convection) environment. Power handling may be limited by connector choice. As the description and calculation attenuation of cable loss as above and below has been describe in [3].
For Fig. 2, is the RG-58 coaxial cable with 10m and connected to 2 N-male type connectors to link between Bilog antenna and Spectrum analyzer.
For Fig. 2, is the RG-58 coaxial cable with 10m and connected to 2 N-male type connectors to link between Bilog antenna and Spectrum analyzer.
For Fig. 3, show the graph of different changing of attenuation in [dB] with each frequency. Frequency is in the x-axis and attenuation is in y-axis, if frequency increase to be bigger and the cable length become longer then the attenuation will be bigger, mean that the loss of RG-58 cable depend on cable length and frequency of experiment. Base on graph of Fig. 3, for example, with the cable length 30.5m and the frequency is 100MHz, so the attenuation is 5dB.
 |
| TABLE II: SPECIFICATIONS OF RG-5 CABLE. |
 |
| TABLE III: CABLE ASSEMBLY PERFORMANCE WITH FREQUENCY OF 106.6MHZ. |
 |
| Fig. 2 RG-58 coaxial cable 10m with 2 N-male connectors. |
 |
| Fig. 3 Data of coaxial cable loss (attenuation) in dB per 30.5m (100ft). |
2) Free space loss: Free-space path loss (FSPL) is the attenuation of radio energy between the feed points of two antennas that results from the combination of the receiving antenna's capture area plus the obstacle free, line-of-sight path through free space (usually air). Free Space path loss in dB formula define as below:
Lf,dB = 92.4 + 20log(d[km]) + 20log(f[GHz])
d: distance between Tx and Rx [km]
f: transmitting frequency [GHz]
For Fig. 4, it is example of comparing the path-loss of the distance and fixed frequencies 2.4, 5.1, and 5.7GHz. To conclude, when the frequency is bigger while the distance, the free-space path-loss will be increase. As the Fig. 4, 5 to see more the description of the path-loss in [4].
 |
| Fig. 4 The diagram of measurement free space path-loss. |
 |
| Fig. 5 Comparing the free-space path-loss of the distance and each frequency. |
II. RF ENVIRONMENT ANALYSIS
A. Estimating at Cambodia-Thai border, Niche café
In that field test, we have checked reference frequencies at Cambodia-Thai border first with antenna height 3m. For checking, we try to check frequencies only from Thailand, so we checked direction for 180 degrees of antenna’s angle to Thailand because the border of Cambodia and Thai is one side of each other.
For Fig. 6, we used Google map for estimating the transmitting antenna source and show the direction of those 2 frequencies from Thailand. For the direction 1, signal maybe come from analysis point1 mark, this is the Chanthaburi towns of Thailand and there are a lot of buildings there and it is about 120Km distance from the testing point crossing over the sea. For the direction 2, we estimated that the signal come from the transmitting antenna of the Prachuab Khiri towns of Thailand and the distance is about 400Km from the testing point.
 |
| Fig. 6 Estimating Google map for environment analysis. |
B. Analyze testing at Koh Kong City Hotel using Google map
For Fig. 7, show the measurement distance from Cambodia-Thailand boundary by using Google map for estimating. After we finished our testing frequency as the reference at Cambodia-Thailand border, we made a testing of 18 hours at Koh Kong City Hotel is about 8.55Km distance by using Google map estimating while crossing the obstacle of the mountains and the free space of sea field from Cambodia-Thailand border to the experiment place.
Totally, environment is the main part of effective to analyze the data signal, it is also focus with the weather, and during we testing our signal, we need to check about environment and weather in the detail.
 |
| Fig. 7 Analyze testing at Koh Kong City Hotel from Cambodia-Thai border by using Google map. |
III. OPERATING DIAGRAM
Base on the diagram above, to process this fully experiment propose we did the test to find frequencies as reference at Khmer-Thai border by focusing to Thai direction. After that, we got two frequencies are 98.5MHz with 300oNW direction and 106.6MHz with the direction of 268oW as the reference from Thailand and then to test it step by step at Koh Kong City Hotel about 10Km distance from the border.
Firstly, we need to find a high position with high power gain which direct to Thailand with no obstacle at hotel and then lets checking the environment around that location to make sure it is free space. After that we started to check the AC input power that provide to Spectrum Analyzer, if AC power source fit to the Spectrum Analyzer input LINE containing, so the operation will be starting.
- Start checking and cleaning those two N-male type connectors of 50ohm impedance which connect by RG-58 co-axial cable and then the connector of BiLog Antenna to protect any impact problem of Spectrum Analyzer.
- Setting start and stop frequency of range from 90MHz to 110MHz to analyze the frequency band and magnitude spectrum of FM by pushing on FREQUENCY button panel.
- Press on TRACE button panel to do the MAX HOLD to signal, and then pushing FREEZE to view the signal.
- Let press on MARKER panel to check each frequencies and magnitude spectrum that show on Spectrum Analyzer’s monitor.
Checking it one by one and update data every 20min until we finish our experiment propose of RF testing.
 |
| Fig. 8 Operation diagram of measurement. |
The diagram of processing this fully experiment proposes as shown below:

IV. DATA ANALYSIS
After finish the experiment of 18 hours, then we got some data
 |
| TABLE IV: DATA OF EXPERIMENT FROM 9:00PM TO 10:40PM. |
 |
| TABLE V: DATA OF EXPERIMENT FROM 11:00PM TO 4:40AM. |

 |
| TABLE VI: DATA OF EXPERIMENT FROM 5:00AM TO 9:00PM. |
 |
| TABLE VII: DATA OF EXPERIMENT FROM 9:20AM TO 12:00PM. |
 |
| TABLE VIII: DATA OF EXPERIMENT FROM 12:20AM TO 2:00PM. |
 |
| Fig. 9 Power gain of each sampling time of full experiment with frequency of 98.5MHz. |
 |
| Fig. 10 Power gain of each sampling time of full experiment with frequency of 106.6MHz. |
In Table I, during 9:00pm to 10:40pm, we observed that the power gain is low if compare to all five tables above. It might because of a lot of people who using those frequencies became low. Therefore, air and small mountains might be a factor too because they are in front of our Bilog antenna direction. Also, it might affect by frequencies which propagate from Cambodia.
In Table II, from 11:00pm to 04:40am, we observed that the power gain is quite high if compare to all five tables. It might because of decreasing of people who using those frequencies and this because of it is a sleeping time and also because of the weather is cool 21oc wind blowing.
In Table III, it is the early morning time during 5:00am to 9:00am, we observed that the power gain is quite as high as Table II. It might because of many people haven’t using this frequency yet, this because of it is early in the morning and the weather still cool with 23oc and wind blowing, but the broadcasting still broadcast the power.
In Table IV, from 9:00am to 12:00am is the morning time, we observed most of the range time that the power gain is extremely high if compare to all five tables. It might because of a lot of people who using those frequencies while they increase power gain to propagate.
In Table V, we observed that the power gain is quite high if compare to all five tables. It might because lack of people who using those frequencies and it is a relaxing too from studying or working.
In Fig. 9, described the power gain’s data of each sampling time of our full experiments with a single frequency of 98.5MHz. Base on the data of the that Fig. 8, see that the power gain of it between 9:00am to 12:00am is the highest gain if compare to other.
Base on Fig. 10, it described the power gain’s data of each sampling time of our full experiments with a single frequency of 106.6MHz. As shown in Fig. 8, see that the power gain of it between 9:00am to 12:00am is also the highest gain and between 9:00pm – 10:40pm is the lowest gain if compare to other.
V. CONCLUSION
 |
| Fig. 11 Comparing power gain of those 2 frequencies of each sampling time. |
According to Fig. 11, show the comparing gain of frequencies 98.5 and 106.6MHz of each sampling time. Base on it, see that the power gain of 98.5MHz is look more better than 106.6MHz, we concluded that because of the transmitter antenna is quite near to our experiment point.
Totally, the experiment propose is to analyzes RF power limitation signal of TV at Koh Kong of Cambodia’s and Thailand’ Border which illegal broadcasting power from Thailand. In this testing, we used the Bilog antenna to operate with Spectrum Analyzer. After we got the data information from this experiment, according to these data will use to analyze which location has obstacle effective, reflected by the building, or any effective else, so that the result of gain power that we got does depend on that effective environment, weather, free-space, and cable loss.
However, at the Koh Kong town cannot get higher gain as at the border since the broadcasting frequencies from Thailand is cross over to Cambodia and it may affect to our living especially people who living there such as; traditional, language, culture, civilization, and nationality.
REFERENCES
Available:
http://www.astat.com.pl/download.php?file=pliki/schaffner_dt_CBL6111C_gb.pdf
[2] Available:
www.idc-online.com/technical_references/pdfs/data.../RG_58.pdf
[3] Available:
http://www.timesmicrowave.com/calculator/?productId=122&frequency=98.5&runLength=32.81&mode=calculate#form
[4] File:FSPL for common 802.11 frequency bands.svg
Available:
https://commons.wikimedia.org/wiki/File:FSPL_for_common_802.11_frequency_bands.svg


0 Comments